

Stats tester mini
### Features of this app ###
1. By using Stats tester mini, you can perform some statistics tests and obtain graphs by an easy operation.
2. Since one sample group (multiple data) is entered in one window, it is very easy to enter or edit the data.
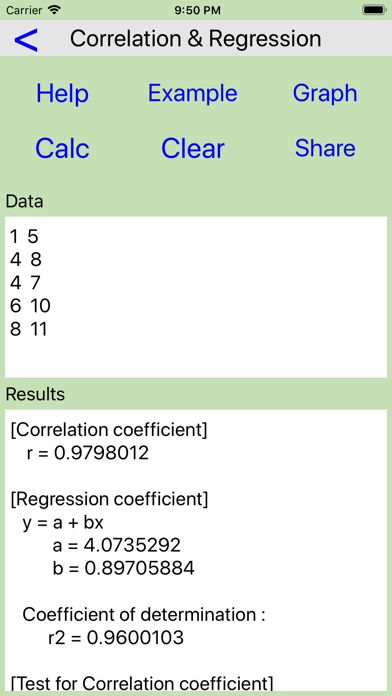
3. Unlike other test apps, not only final conclusions such as p-values, but also intermediate results are shown.
4. Input data and test results can be recorded by sharing (mail, memo). There is no need to make notes on paper.
5. You can import data by copy/paste from apps such as Excel, Numbers, memo, etc.
6. Numerical input is very easy with the built-In ten-keyboard (phone and calculator layouts).
7. This app has been fully verified to work with the M1 Mac. The M1 Mac makes it easy to work with other apps (Numbers, Excel etc.).
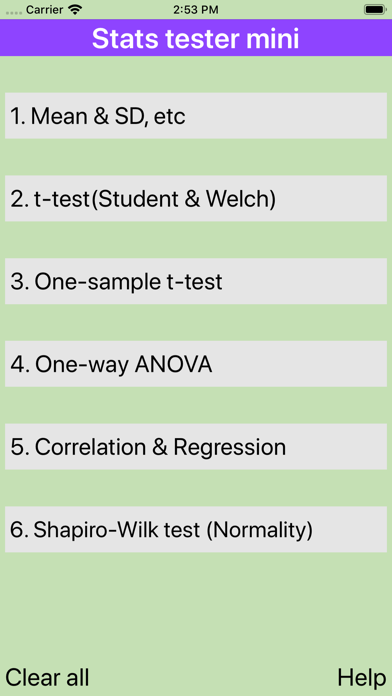
Each test screen has [Help], [Example], [Graph], [Calc], [Clear] and [Share] Buttons.
On the "How to use this app" screen, details such as its features and specifications are written.
Below are the statistical methods in Stats tester mini. (The upgraded version "Stats tester plus" offers 18 more methods.)
1. Mean, SD, Skewness, Kurtosis, etc.
1) Arithmetic, Geometric and Harmonic means
2) Standard Deviation (2)
3) Standard Error of the mean (sem)
4) 95 and 99% Confidence interval (CI)
5) Sum
6) Sum of Square
7) Variance, Unbiased variance
8) Coefficient of variation (%CV)
9) Skewness (2)
10) Kurtosis (3)
11) Graph
2. Median, Range, Quartiles and Boxplot.
1) Median
2) Maximum
3) Minimum
4) 1st Quartile
5) 3rd Quartile
6) Quartile Deviation
7) Boxplot Graph
3. One-Sample t-Test (to Specified Mean)
1) Mean
2) Standard deviation (2)
3) Standard error of the mean (sem)
4) One-sample t-test --> p value
5) Confidence interval (CI)
6) Graph
4. Two-Sample t-Test (Students and Welchs t-Tests)
1) Mean
2) Standard deviation (2)
3) Standard error of the mean (sem)
4) Student t-test --> p value
5) Welchs procedure --> p value
6) Graph
5. Paired-Sample t-test
1) Mean
2) Standard error of the mean (sem)
3) Paired t-test --> p value
4) Graph
6. One-Way Analysis of Variance (ANOVA)
1) Mean
2) Standard error of the mean (sem)
3) Analysis of variance --> p value
4) ANOVA table
5) Graph
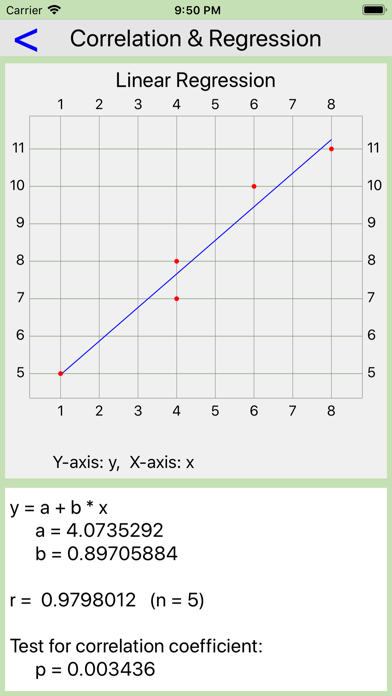
7. Linear Regression and Test for Pearson Correlation Coefficient
1) Correlation coefficient
2) Regression coefficient (Linear Regression)
3) Coefficient of determination
4) Test for correlation coefficient --> p value
5) Graph
8. Shapiro-Wilk Test (Normality) and Q-Q Plot
1) Kurtosis α4 (α4=3 --> normal distribution)
2) Shapiro-Wilk test --> p value
3) Q-Q Plot (Normal probability plot) graph
9. Chi-Square Test (2X2 Independence)
The iOs Chart library distributed under the Apache 2.0 license was utilized to make graphs.
https://github.com/danielgindi/Charts
http://www.apache.org/licenses/LICENSE-2.0.html